
As of the writing of this article, there are over 500 listings on HTMJobs.com. There are many contributing factors that have brought the healthcare technology management (HTM) field to this critical juncture, not the least of which was known to us at least 4 years ago.
In 2018, at an Association for the Advancement of Medical Instrumentation (AAMI) meeting known as Future Forum IV, it was identified that “Over the next few years, it is estimated that about 5,000 biomedical equipment technicians (BMETs) will be needed to meet the growing demand for professionally trained and experienced service professionals. At the same time, an estimated 33 degree-producing schools have closed their healthcare technology management (HTM) related programs in recent years (24 associate-level programs and nine bachelor-level), leaving only 22 accredited colleges that graduate approximately 400 BMET students each year.” If you do the math and presume that a “few years” may be three or four, we will fall somewhere between 3,400 and 3,800 HTM professionals short of our needs. I believe we can all validate this in our own experience.
So, vacant positions most likely effect the majority of HTM shops around the country. From this I would like to formulate a discussion – What is it that creates a vacancy and/or a demand in labor? Arguably, the resignation of a technician does not necessarily mean that you need to replace them. You may have closed a facility, unit or practice that decreases your overall service commitment; you may have increased the capacity of the remainder of the team through training and/or experience resulting in increased efficiency; you may have changed operational service practices that have decreased overall workload. Or maybe not. The point is that we are not obligated to replace a body for a body, but rather we are replacing lost productivity with productivity which ultimately is a measure of time and/or labor hours, not physical head count. The required observations then become, do we need more labor to satisfy production requirements, or can we find a way to decrease our required labor needs, or can we increase the productivity of the remaining team members consequently increasing labor availability, or some combination of the latter? Ultimately, with the hiring issues indicated, you will be operating with a vacancy for a while anyway, so how do you capitalize on the resources you already have?
Industry colleagues are also hiring competitors, passing the same talent between each other with limited infusion of new talent. What should we consider when trying to do more with less? Quite simply, you don’t necessarily need the staff you have to do more work (hours), but rather we need them to do more effective work (productivity). This effectiveness can manifest itself through the successful implementation of targeted process and practice improvement that is focused on those activities that are killing productivity. How do you know where your team is spending its time, or what activities are you doing that you really don’t need to be? The key is data. We have a sign up in our shop that simply reads, “If you’re not measuring, you’re not succeeding.” Success in something implies the possibility of failure. This would need to be determined by some sort of quantitative measurement.
We all measure some of the same stuff, like preventive maintenance (PM) completion rate at various times during the month, but do you know the average time it takes to complete a particular PM? Could an outlier technician benefit from training to increase efficiency? Are you investing time in performing PMs on devices whose risk and failure rate do not warrant it? Are you routinely evaluating equipment service history and making recommendations to move equipment to an alternative equipment maintenance (AEM) program? Are you developing written policy and/or procedures for those administrative or technical tasks that are particularly time consuming? Does the time required vary widely depending on the technician performing the work?
I’m certain that all the ideas above are familiar to everyone reading this article, but familiarity does not necessarily translate into practice. At various presentations around the country, I’ve had department leaders tell me that they, “Can’t get my people to do that” when referring to the implementation of new metrics and monitoring practices. Unfortunately, given the current economic state of the county and the number of eligible candidates in the industry, something will have to give – either we figure out how to do more with less or we actually do less, and overall patient safety will suffer. With reference to the items above, here are some real-world examples of the benefit of investing in yourselves.
AEM
This topic has been getting a lot of press the past few years, but many organizations are still hesitant to implement one. I suppose there is a lot of security in the perceived limitation of liability associated with performing preventive maintenance on everything and the kitchen sink “in accordance with manufacturer’s recommendations” but is there actual benefit to the time invested? TJC and CMS were nice enough to make alternative maintenance plans an option, it would be worthwhile to see if it could benefit your team.
As an example, some organizations out there still preform “preventive maintenance” on electronic thermometers. For argument’s sake, lets presume that a 1,000-bed medical center has 1,000 thermometers that all require annual inspection. What is the labor expenditure to complete this task? Each thermometer would need to be located, each would have a work order requiring documentation, and don’t forget we need to put a sticker on each one – so let’s assume 15 minutes each for paperwork, location and a thorough examination – that’s 250 hours every year or ⅛ FTE. Now ask yourself, when was the last time in the last decade a thermometer failed in a manner that did not generate an error code and prevent use? They don’t. They have dead batteries, physically broken probes, a broken display or internal errors that prevent use. At best, this process is an inventory control method. Now, apply this logic to patient monitors, infusion pumps, feeding pumps, etc. It’s a real simple formula …
2080 (FTE Labor Hours/year)
FTEs Saved = (Number of equipment items) x (PM time in hours)
I’m not suggesting you don’t PM a device without sufficient evidence that such action will not adversely affect the equipment. However, just about everything out there can stand an adjustment of some kind that will reduce your labor effort and every little bit helps. It’s worth remembering that an OEM writes their PM procedures very liberally as a function of limiting liability, not necessarily with labor impact in mind.
We have an active inventory of over 32,000 devices, around 6,400 of which (20%) receive some sort of PM. We have had our AEM program in place for around 7 years and have had two TJC inspections without a single eyebrow raised as to the effectiveness of our maintenance practices. Once again, this process requires you to measure and routinely validate the effectiveness of your program based on out of cycle PM related failures and to adjust as needed. It is also important to note that, based on our metrics, we spend approximately .82 hours per PM or 5,250 hours per year or two full-time FTEs. If we extrapolate this rate to a non-AEM inventory of 32,000, we could reasonably expect to need at least 3 times the labor or 6 FTEs to accomplish essentially nothing. There are opportunities to reduce your required PM labor by investing in a through AEM program.
Team Productivity, Metrics and Huddles
People don’t generally associate gathering and analyzing metrics (which takes time) and having daily huddles (which takes time) with increasing overall team productivity (reducing time), but there is something to be said for having everyone on the same page and working toward the same goal. The development of effective metrics can be a painful process but will be worth the effort. For the most part, the development, analysis and communication of metrics are a leadership function, but in our facilities, they are required by every technician to monitor a small sample of data specific to their own performance:
- Personal PM Progression (daily; 5% per day or 25% per week)
- High-Risk PM Progression (daily; must complete a HR PM every 3 days)
- Actionable Unscheduled Work Orders over 7 days old (daily)
The technicians report on this data at a short 15-minute daily huddle by simply indicating if they are Red (have a barrier) or Green (progressing as expected).
As a leader, I gather and analyze over 60 individual data points on a daily basis on both general productivity and individual performance. Of these data points, a few are extrapolated for presentation at the daily huddle:
- Unscheduled calls and calls remaining open (previous day)
- Daily PM Goal, Current PM Progression (daily), Open High-Risk PMs, Open Non-High-Risk PMs
- Open Unscheduled Work Orders, Open Actionable Unscheduled Work Order over 7 days old
- Total Work Orders Completed, Average Work Orders Complete Per Tech (previous day)
- Open Cannot Locate PM Work Orders
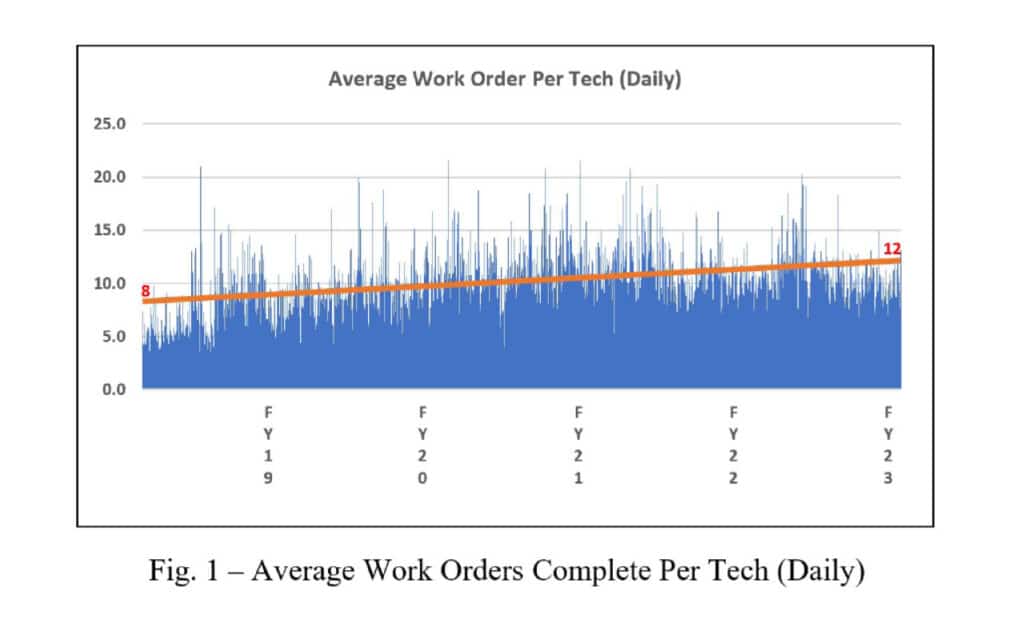
This may look like common management information, but the act of presenting it to the team on a daily basis and, as a group analyzing and focusing attention to areas of concern, while considering individual barriers, has an amazing effect on inspiring ownership of the entire operational goal. There are of course other factors that facilitate individual ownership of the work such as how we divide PMs, how unscheduled work is assigned, how call is rotated, assignment to special projects, etc., but the result is that everyone on the team is a fully engaged process owner. As you can see from Figure 1, over the course of 4 years, the individual (per technician) work order production has increased from 8 to 12 work orders per day on average. Four work orders may not seem like much but consider that 4 work orders a day multiplied by 11 technicians is 44 work orders per day, 220 work orders per week, 880 work orders per month and 10,560 work orders per year, which is equivalent to 3.6 FTEs per year at 12 work orders per day. This can be directly attributed to simply monitoring basic metrics and making incremental changes to policies and processes while addressing individual barriers.
 Training
Training is another area that is often overlooked as a way to reduce time spent on technical activities, mostly because it cost hard dollars to train for a payout in soft dollars, but the ROI can be much greater. Some leaders get nervous training new hires and some fear investing too much in one technician for the same reason – retention and loss of those training dollars. Some do not acknowledge the fact that training itself can aid in retention, both long and short term, but regardless, you will get some level of return out of it. The alternative to training is either increased liability, failure rate, downtime and/or contract costs, and a decrease in staff retention. Incidentally, the cost to recruit, on board and train a replacement technician is generally accepted to be around 200% of the annual salary of the lost employee, so beyond the obvious, retention has its merits.
From a labor consumption perspective, training will increase your team’s troubleshooting effectiveness, decreasing troubleshooting, parts identification and repair times. This not only benefits your team, but the financial health of your organization in patient throughput, patient satisfaction, clinical staff satisfaction and physician satisfaction, not to mention a positive impact on overall liability. As an example, consider the replacing of a cath lab table side control which is a fairly easy process, but sometimes requires the downloading of software that can only be accessed from service mode. In order to get into service mode, you need a service key which can only be attained by going to a service school. So, the scenarios are:
No Trained FTE
- System goes down, work order is opened and dispatched. FTE places service call to vendor (may or may not require PO)
- Vendor arrives 4 hours later (minimum response) diagnoses system and orders parts (may or may not require PO or authorization)
- Vendor arrives next day after 10:30 a.m. and installs parts, provides service report.
- FTE documents service. Total administrative time – 1.5 hours. Total system downtime – 24 hours
Trained FTE
- System goes down, work order is opened and dispatched.
- FTE goes to the cath lab with in-stock part and service key, installs part and software
- FTE documents service call. Total time – 0.75 hours. Total system downtime – 0.5 hours.
In general, trained FTEs are faster, more confident and more efficient in their troubleshooting and repair efforts. As an added bonus, they can be relied on to train other technicians in first-look activities. Training can be considered an investment in labor reduction.
We as a career field cannot expect a bolus of qualified and trained technicians to enter circulation in the near future. We also cannot expect a reduction in the need for qualified and trained technicians to support an increasingly complicated environment of care. We are expected to perform as efficiently as possible with the resources we still have but cannot honestly say that we are, without evaluating, measuring and training for success.
To summarize, I was at a meeting with some other leaders from around my state and I asked the question, “Do we need more people or more time?” and the answer was “Yes!” But which one do we have more control over in the current environment? I would argue that optimizing the efficiency of your current resources is much easier than controlling resources you cannot find.
References
Forum Participants Tackle HTM Personnel Pipeline Shortage. (2018, April 3). Retrieved from https://www.aami.org/newsviews/newsdetail.aspx?ItemNumber=5844
Dallas T. Sutton Jr., BS, CRES, is a Clinical Engineering Manager for WakeMed Clinical Engineering.
