

By Joe Fishel, CBET
The task of measuring productivity in the HTM world has been a cause for discussion over the years and continues even today. How it should be calculated is often a lively topic of discussion? Some questions that come up are, “Do you document everything you do? How do you account for lunch and breaks? What is the benchmark — 70%, 80%, 90% or 100%?” These questions hold up the true explanation of productivity which is, “How can you tell if a technician is productive?”
For years, the accepted calculation was to compare hours available to hours worked. This is an accounting of time, not productivity. In the HTM world, we have various tasks that pull us in different directions. But at the end of the day, it doesn’t really tell if a technician was productive or not.
Early in my career, I oriented with a tech at another facility prior to his vacation. I was going to be covering the infusion pump desk in his absence. He instructed me to only fix eight pumps a day. His justification was there are only eight work hours in a day and it takes an hour to work on one. He stated that was his standard and not to screw it up for him. When I showed up on Monday, there were so many broken infusion pumps in the office that I could not get to the desk. I started the day by assessing a pump. Fifteen minutes later I had identified the malfunction, cleared the error and set it up to run for volume testing. I now had 45 minutes to burn. I could not take the inactivity and commenced to plug in pumps to charge and see what was going on. I was able to set up four calibration stations to verify pump accuracy. By the end of the day, I had put 16 pumps back in service. By the end of the week, I had touched 102 pumps and returned 96 to service. I could now get to the desk. We both worked a 40-hour week and documented our work, but the number of repaired devices was 40 to 96. Over the same time span, I was about 141% more productive.
What rules should we make or consider when setting up a productivity assessment? What time should we include in a work order?
- Do you count 15-minute breaks and lunch breaks?
- What are the true available hours to work in a day?
- Do we document all our time and what we do including the time to retrieve a device as well as return it?
- Do we include the time used to research for a part?
- Do we include the time it takes to get a purchase order?
- Do we include the time needed to pack a device for shipping?
- Do we include the time needed to arrange for a loaner?
Be sure to identify clearly what is administrative time, project time, rounding and each specific classification.
All of this standardizes the documentation so that everyone is doing it the same way. This is important so that you can compare apples to apples. You are documenting what you do in eight hours.
The easiest way to start looking at productivity is to pick one model of a device that most of the techs do PMs on. IV pumps would be high on my list to start with. I would compare PMs as the steps are standardized by the manufacturer. There are two benchmarks you should incorporate in your computations. The first benchmark is the manufacturer’s estimated PM time. The second is to take a year or two of the total average of all PMs for that model. This will create an average PM time. Next, separate each technician’s average PM time for the same device model and put the data on a graph. This will create a picture of where everyone is in their productivity when it comes to that model of device. When you look at the chart below you can see that Techs 1, 2, 6 and 7 are performing the PM in a time shorter than both the facility average and the manufacturer’s estimate.
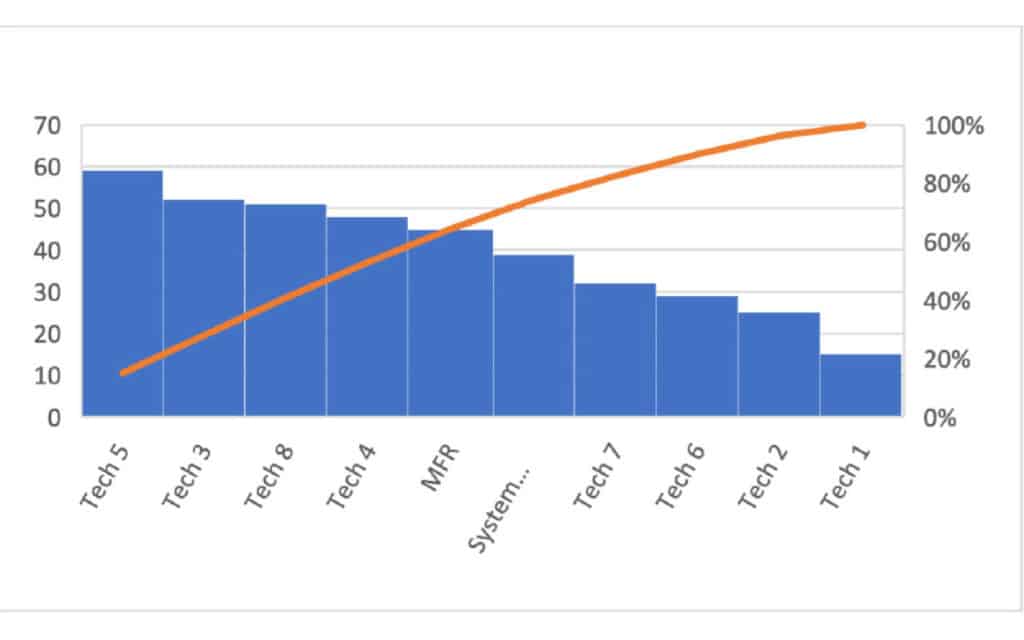 From the chart above, we can see which one of our techs are the most efficient doing pump PMs. Also, if there is a step (such as a volume infused test) that takes a minimum of 15 minutes then I would question the quality of the PM by Tech 1.
Once you have completed one device productivity analysis, I would determine your top 10 devices and do a chart for each of those devices. Do a chart for the top 10 devices and then score each tech for each device. For example, if they were third on an ESU then give them a 3. Then, total up each technician’s score to see where each stands compared to their colleagues.
After you have done the PM numbers for each of the devices you can start on correctives. You can also look at administrative time, travel time, project time and other categories. You will only have an average benchmark from your facility, but it will assist you in seeing where time is being spent. No one is 100 percent productive, but they can document 100% their time.
No matter what calculation is used, it still comes down to the need for accurate documentation. I welcome suggestions, but I believe the HTM community needs to develop standards that work.
Joseph Fishel, CBET, is a Nuvolo business process consultant/ HTM.
